Image Credits: mdst.co.uk
Based on our latest containership databank and excluding intra-regional markets, we count 67 shipping lines operating fully cellular containerships in the container shipping industry. However, more than 87% of fleet capacity is controlled by only 10 of them, representing just fewer than 7% of the total lines.
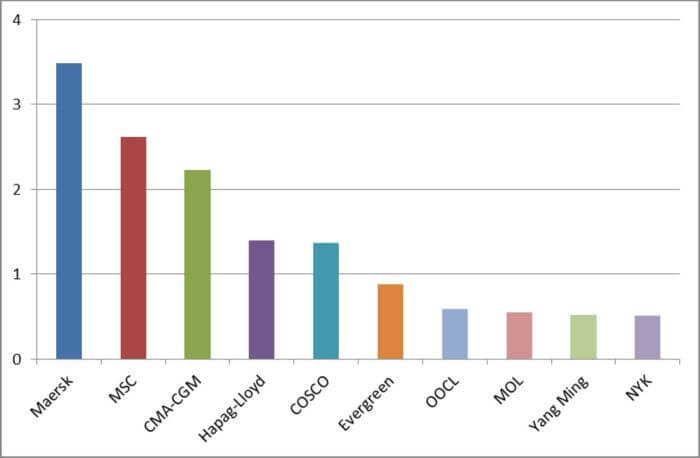
At the top of the list is now Maersk Line. Having acquiring Hamburg Süd in December 2017 it has surpassed its Alliance counterpart Mediterranean Shipping Company (MSC). Maersk’s capacity is now estimated to account for over 21% of the global market (excluding intra-regional), as shown in the following figure.
Looking back only four years ago, before Maersk Line and MSC formed the 2M Alliance starting de-facto the wave of consolidations and Mergers and Acquisitions (M&As), shares amongst the lines were more evenly spread.
Over the last four years, we estimate that the top 10 shipping lines have seen their combined market share increase from 68% to 83%. During the same period, the top 10 lines have seen their deployed capacity increase from some 55m TEU to 86.7m TEU. Apart from the formation of the 2M Alliance, the other key consolidations and M&As characterising this period have been as follows:
- CMA CGM’s acquisition of APL in September 2016. The French carrier has since enlarged its fleet from 1.7m TEU May 2016 to 2.4m TEU in January 2018 now accounting for 13.7% of the total global deep-sea fleet capacity.
- The Alliance: an East-West alliance consisting of Hapag-Lloyd, K-Line, MOL, NYK and Yang Ming, began operations in April 2017.
- Ocean Alliance: which began operations in April 2017 is an East-West alliance involving CMA-CGM, COSCO, Evergreen, OOCL.
- Maersk completed its purchase of Hamburg-Sud in December 2017.
- Hamburg-Sud purchased CCNI in 2015.
- Hapag-Lloyd acquired CSAV in December 2014 and more recently UASC in 2017.
The cycle of consolidations and M&As is far from over. Orient Overseas Container Line (OOCL) is to become part of China Ocean Shipping Company (COSCO) sometime this year; their combined share in the deep sea trades is estimated to be around 12%. In April 2018 the container divisions of Nippon Yusen Kabushiki Kaisha (NYK), Mitsui O.S.K. Lines (MOL) and Kawasaki Kisen Kaisha (K Line) will merge, forming a joint venture called Ocean Network Express (ONE). We estimate their combined share of the deep sea trades to be 8.7%.
With fewer lines dominating the market, it is justifiable to pose the questions ‘Is there enough competition? What is happening to the smaller lines?’ Tables 1-3 illustrate the major changes in the networks offered by the lines in the last four years. The tables show that the larger the line, the easier it is to change the network it can offer, which translates into more flexibility and adaptability to changing market conditions, putting the smaller operators under increasing pressure.
On the major three East/West routes, the market is dominated by the three alliances although at different magnitudes. The following three charts show that, on the Asia-Europe routes, lines that are not part of alliances account for just 1% of the total deployed capacity, whereas on the Transpacific and Transatlantic routes, they account for 11% and 17% respectively.
On the Transpacific trade, the Ocean Alliance is the dominant player with a deployed capacity share of 41%, followed by The Alliance with 28%. The 2M Alliance’s share of 20% is less than half of the Ocean Alliance deployment and, at 11%, the Transpacific has the highest non-alliance market share of the East-West trades.
With a deployed capacity share of 44%, the 2M Alliance is the largest alliance on the Transatlantic trade lane. The Alliance is second with a capacity share of 31% with the Ocean Alliance in 3rd with 18%.
2M Alliance leads the way in terms of deployed capacity share on the Asia-Europe route at 40%. Following closely is the Ocean Alliance at 36%, whilst THE Alliance deploys 23% of the capacity on this trade lane.
Looking at the three major East-West trade lanes combined we see from Chart 7 that the Ocean Alliance at 36% is the largest by deployed capacity, next is the 2M Alliance with a share of 32%. The Alliance contributes 26% of the market share whilst the remaining 6% consists of the non-alliance members.
On the individual routes, we notice that M&As and consolidations could indirectly offer opportunities for small players. For instance, the strict conditions imposed by the Regulatory Authorities on Maersk operations after the acquisition of Hamburg Süd have offered the chance for a small line, in this case Pacific International Lines (PIL), to launch a service between Asia and South America EC. However, the longevity of this kind of services is far from certain as they will be subject to rates volatility.
Reference: mdst.co.uk